
Data Intelligence Center
We transform data into strategic decisions
for businesses and researchers
Data & Intelligence Solutions
For businesses that want to grow and researchers pursuing excellence
Dashboards & BI
Interactive Power BI dashboards with real-time KPIs for data-driven decision making.
Process Automation
Eliminate manual tasks with Power Automate, Python, and system integrations.
Low-Code Applications
Custom Power Apps applications to digitize processes and create mobile solutions.
Systems Integration
We connect ERPs, CRMs, and databases for a unified view of your business.
Data Observatories
Continuous monitoring dashboards to track indicators, trends, and research metrics.
Bibliometric Analysis
Scientific production mapping with the HySCo method for systematic reviews and trend studies.
AI Tools for Research
Intelligent assistants for article analysis, insight generation, and academic writing support.
Database Processing
Merging, cleaning, and standardization of bibliographic databases (Scopus, Web of Science, PubMed).
Tools for Researchers
AI and automation at the service of scientific production
PaperLab AI
Generate scientific article drafts with traceable citations from your PDFs.
SmartChat
AI assistant for academic research. Chat, article search, and document analysis.
Merge Databases
Merge Scopus + Web of Science databases with automatic duplicate removal.
Bibliometric Analysis
Publication, author, and keyword statistics using the HySCo method.
How it works
From first contact to a working solution in weeks
Initial Conversation
We understand your needs, data sources, and goals. No commitment.
Proposal & Scope
We define deliverables, deadlines, and methodology. Simple projects in 1-2 weeks, complete projects in 4-8 weeks.
Development
Incremental deliveries so you can follow the progress. Reviews and adjustments included.
Delivery & Support
Solution implemented, training delivered, and ongoing support.
Recent Projects
Interactive dashboards developed for our clients
 Power BI
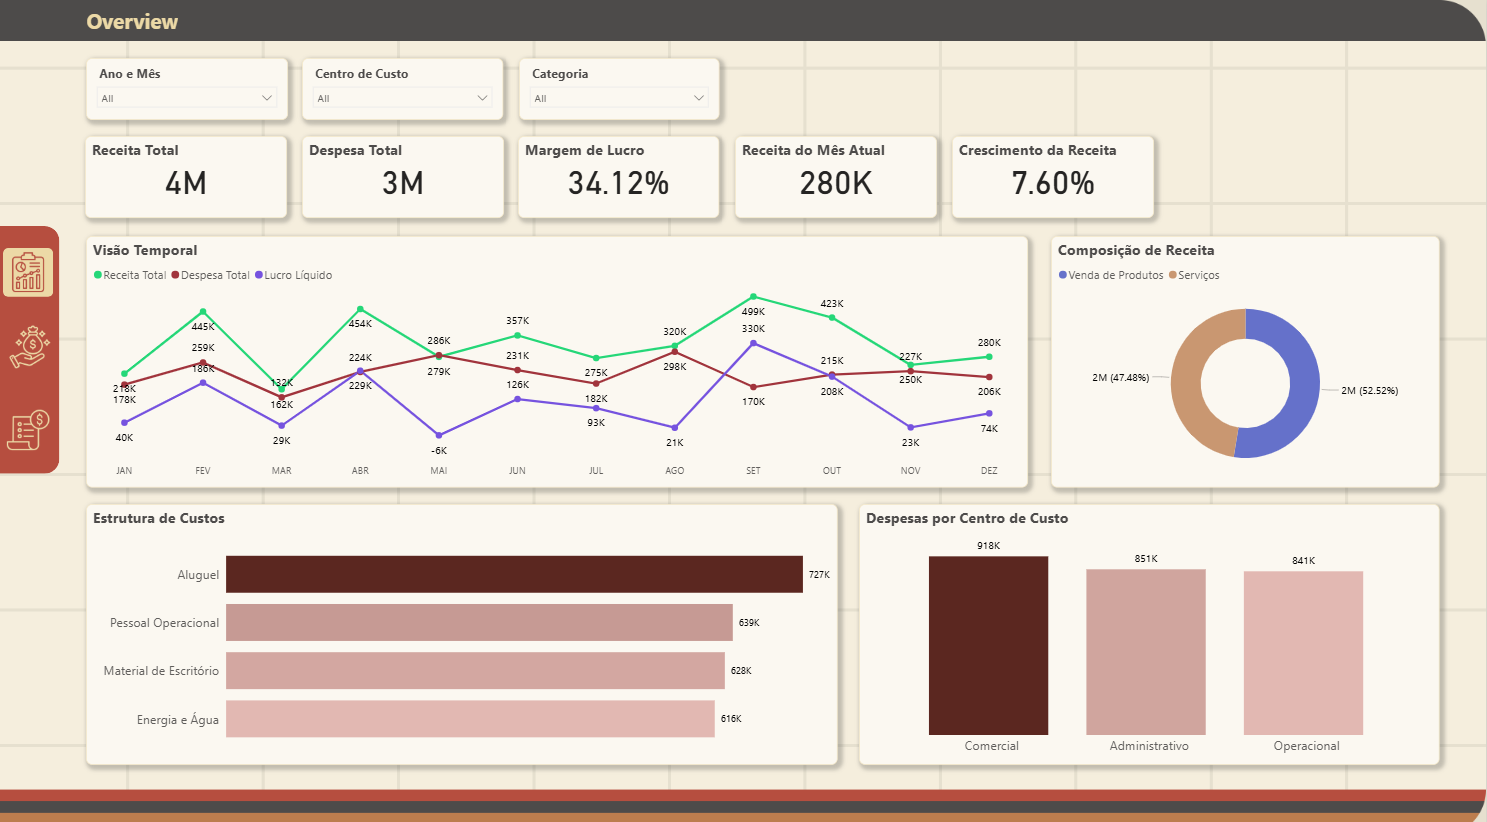
Revenue and Expenses Dashboard
Events Company
Dashboard for detailed analysis of revenue and expenses, with profit margin KPIs, monthly growth tracking, and temporal view for financial decision-making.
 Power BI
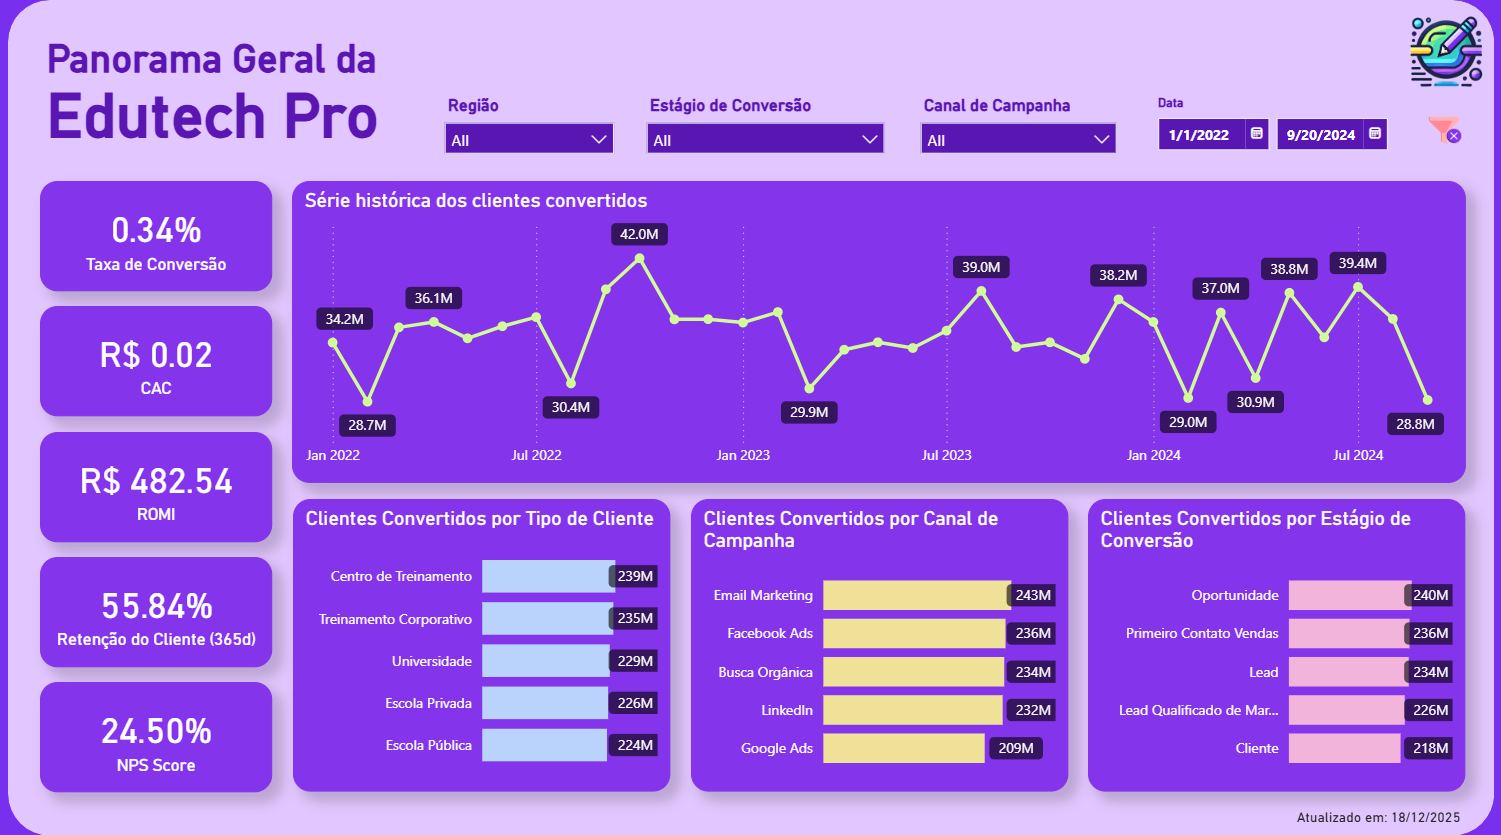
Marketing and Sales Dashboard
Edutech Company
Dashboard for tracking sales funnel, marketing campaigns, lead conversion, and real-time ROMI analysis.
 Power BI
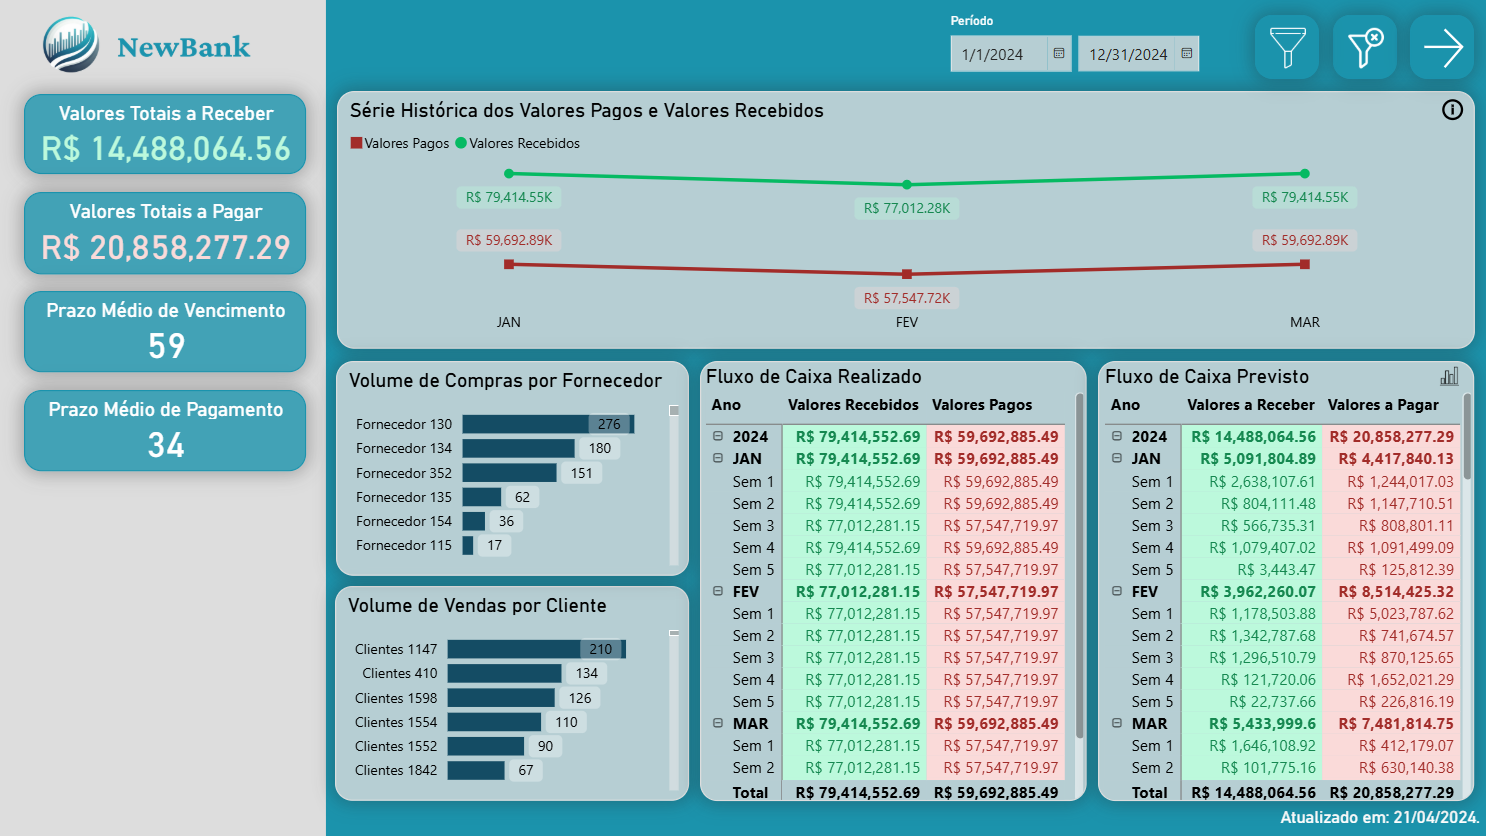
Financial Dashboard
Fintech Company
Dashboard with income statement, cash flow, accounts payable and receivable, plus budget projections for efficient financial management.
Technologies We Master
Market-leading tools to deliver results
Ready to transform data into strategic decisions?
Whether for your business or research project, let's talk with no commitment. First meeting is free.